Use Statistics Filters and KPIs
Interpret event, audience, duration, language, retention, and other KPIs with reproducible filters.
Written By 4ALL.LIVE
Last updated 2 months ago
Interpret event, audience, duration, language, retention, and other KPIs with reproducible filters.
Best for: Authorized producers, analysts, accessibility leads, organization owners, and support staff.
Before you start
Availability depends on role, event access, plan entitlements, retained source data, export/AI/statistics features, and privacy policy.
- Confirm exact organization, event, language, and reporting period.
- Verify requester, recipient, and retention/privacy authorization.
- Preserve raw source data before cleanup, editing, or deletion.
Step by step
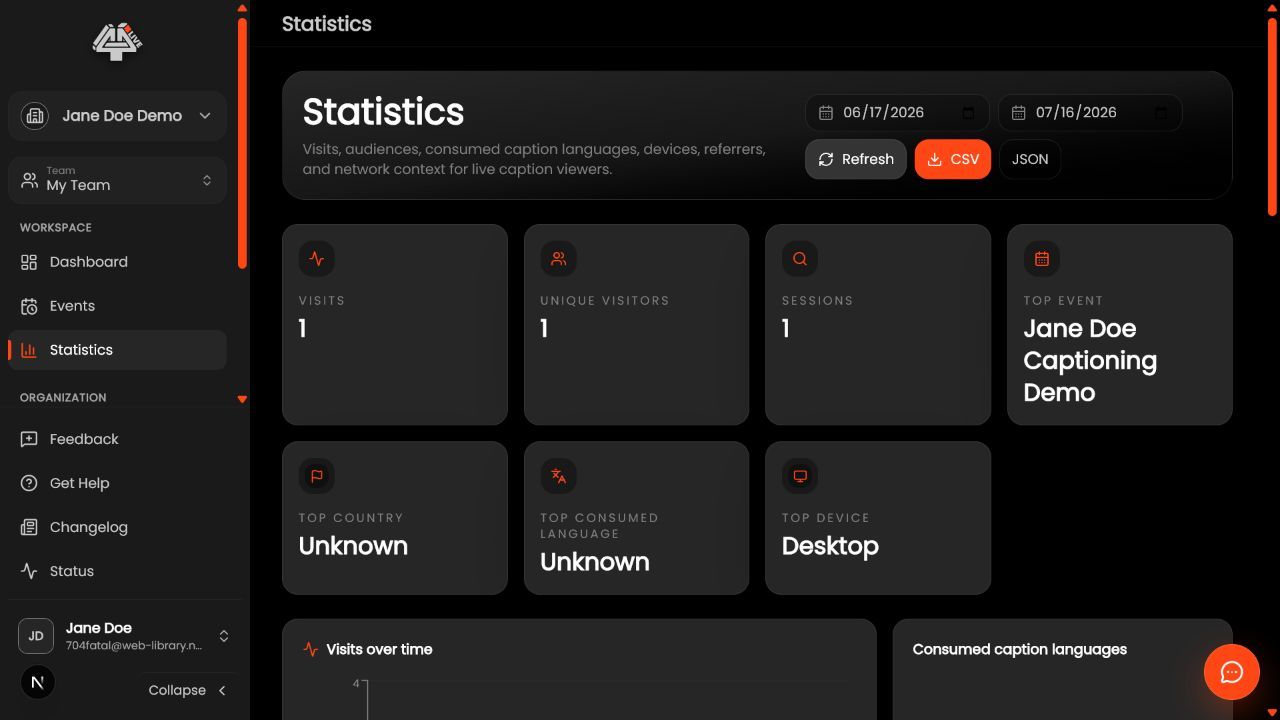
- Open Statistics. Confirm organization/role.
- Set range/time zone. Align period.
- Set event/team filters. Record them.
- Read definitions. Event, session, viewer, view, duration, usage, retention.
- Compare cautiously. Schedule, distribution, bots, incomplete events, freshness.
- Drill into events. Use context/audit.
- Cross-check billing separately. Different definitions.
- Document report. Filters, time, freshness, caveats.
What success looks like: The deliverable or analysis is correct for the intended scope, reviewed, reproducible, and protected according to policy.
Check your setup
- Another analyst reproduces view.
- Definitions stated.
- Billing not conflated.
Troubleshooting
KPI changes
Check late data/freshness/filters.
Event missing
Check time zone/range/team/status/retention.
Invoice differs
Use billing meter/rate definition.
Security and operational notes
- Approximate viewers are not exact people.
- Protect access.
- Record filters.
Related guides
- Understand Retention and Event-Level Statistics
- Interpret Audience and Technical Analytics
- Understand Usage Meters and Overage
Documentation status: Draft for operational, privacy, and analytics review before publishing.